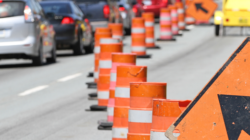
|
Bicycle Use and Safety In Paris, Boston, and Amsterdam
Published in
Transportation
Quarterly J. Scott Osberg, Ph.D. 1,2 Sarah C. Stiles, Ph.D., JD 1 1 Department of Physical Medicine and Rehabilitation, New England Medical Center, Boston, MA 2 Tufts University School of Medicine, Boston, MA
Please address correspondence to Scott Osberg, Director of Research, AAA Foundation for Traffic Safety, 607 14th Street, NW, Suite 205, Washington, DC 20005; Email: sosberg@prodigy.net An earlier version of this paper was presented at the 4th World Conference on Injury Prevention and Control in Amsterdam, The Netherlands. May 18, 1998. Abstract This article examines bicycle use and safety behavior in Paris, Boston, and Amsterdam. Population-adjusted bicycle and passenger car death rates in France, the United States, and The Netherlands provide context for understanding bicycle use and safety behavior. Observation data on helmet use and use of lights at night are also presented. Boston has the fewest bicycles per hour at 55, Paris is next at 74, compared to 242 cyclists per hour in Amsterdam. Thirty-two percent of Boston cyclists wore helmets versus only 2.4% of Paris cyclists and only 0.1% of Amsterdam cyclists. In contrast, Paris cyclists were far more likely to use lights at night (45.2%), than Boston cyclists (15.6%) or Amsterdam cyclists (7.6%). With bicycle and car deaths as the numerators, and the French, U.S., and Dutch populations as the denominators, the Netherlands appears to have a dramatically lower death rate for people in passenger cars and for the combined group of cyclists and passenger car occupants. Transportation safety policies in the Netherlands appear to be working better than policies in the U.S. or France. Politicians, transportation planners, and safety experts can learn a lot from the Dutch about how to promote cycling and build a safe bicycle-friendly environment. Introduction Walking, riding a bicycle, horse, or riding in a horse-drawn carriage were still the main transportation options in many U.S. and European cities one hundred years ago. Even large cities had fairly stable transportation needs over many decades, and when change did occur, extensive planning was not always done first. Nowadays, many cities have large transportation offices, with professionals skilled in transportation planning, civil and environmental engineering, politics, and law (Levinson 1996). Changes in transportation options no longer just happen.
Planners have been shaping Europe’s cities since medieval times, but the tradition of town planning is much newer in the United States (Heidenheimer, Heclo, and Adams 1983, p. 241). Moreover, according to Fegan (1995), U.S. traffic engineers have received less “training in the design of facilities to accommodate bicyclists and pedestrians.” In the United States, the automobile reigns supreme. Politicians bankroll their campaigns with automobile-related, not bicycle-related contributions. In contrast, in some European countries, cycling is actually seen as a viable transportation option, championed by politicians and transportation planners alike. In this paper, we discuss bicycle use and safety in three cities: Paris, Boston, and Amsterdam. Population adjusted bicycle and passenger car death rates in France, the U.S., and The Netherlands provide context for understanding bicycle use and safety behavior. First, a brief introduction to the cycling scene in the three cities is needed.
Paris The bicycle was invented in France and it remains a cultural icon, as revered as baguettes and berets. France is the scene of the world’s most famous bicycle race, the Tour de France, and by U.S. standards, cycling seems incredibly popular. However, other Europeans consider the French to be avid bicycle racing fans, but less interested in cycling as a form of transportation.
Parisians are heavily dependent on mass transportation and motor vehicles. The Paris metro is recognized as one of the best in the world and is connected to an excellent high-speed rail system serving the rest of the country. Despite the extensive mass transit system, small European-sized vehicles choke the city with pollution (Giovannangeli 1998), producing almost daily air quality alerts.
The situation has reached critical proportions. The French government is trying to encourage cycling with dedicated bicycle lanes and car-free Sundays on major thoroughfares, but this has not yet had a major impact other than as a popular recreational activity. High gasoline taxes are aimed at discouraging driving and helping the government cope with the high social costs of pollution and highway construction.
In 1994, the French Environment Ministry joined forces with the Transportation Ministry to create "Mission Vélo” (“Project Bicycle”; Chaumien, 1995). More than just political rhetoric, the Environment Ministry funded ten projects in cities across France, allotting one million French francs to each of the projects (about $200,000 U.S.). The French projects were based on the Dutch model, with efforts made to push for the bicycle as a viable means of transportation and elevate it from its “second class citizen” status compared to motorized traffic. The French bicycle project included a broad coalition of government representatives, urban engineers, the French railway industry (including the SNCF and RATP in Paris), the bicycle industry, bicycle enthusiast groups, and general associations of transportation users (Chaumien 1995).
At the municipal level, the Conseil de Paris adopted the "Cycling Charter" in November 1996. The Charter lays out the goals of municipal policy in Paris for making “cycling both safe and pleasant so that it can become a means of transport in its own right" (Dansk Cyklist Forbund 1998).
Bicycle safety is important in Paris and European-style methods for achieving safety are preferred. There is little interest in bicycle helmets. The Internet and French cycling magazines have considerable information on the French cycling scene and the bicycle as a mode of "sustainable transport," however, we found nothing on helmet promotion in France. In fact, the Strasbourg-based European Cyclists' Federation (ECF), comprised of 300,000 cyclist members in 20 countries, has officially declared its opposition to mandatory bicycle helmet laws (European Cyclist Federation 1998). According to the ECF, requiring helmets would discourage the businessman, mother or shopper from cycling. Ernst Poulsen, a Dane involved in the European Cyclists Federation, expresses a typical European view of helmets: Properly designed cycle helmets can avert some cycling deaths and injuries. The effect on safety is however secondary in nature and is often exaggerated. Cycle helmets make cycling less convenient and should, therefore, by no means be compulsory (Poulsen 1995).
Public opinion surveys in Lille, a French city of about one million people, show that 71% of those polled supported road conditions that favored the bicycle over the automobile. The three principal reasons people gave for their hesitancy to cycle were, first, the safety issue -- cycling with automobile traffic can be dangerous; secondly, the risk of theft; and finally, the vagaries of weather (Heran 1995). It is ironic that people are most worried about getting hurt, yet public safety studies in France and elsewhere (Heran 1995) show that the risk of bicycle-related injury or death is minimal compared to the risk of automobile-related trauma.
Boston The 1991 Intermodal Surface Transportation Efficiency Act (ISTEA) rewrote the rules for transportation planning in the United States (Ochia 1993). According to one pamphlet describing ISTEA: “It’s time for the transportation community to rethink its attitudes and actions regarding bicycling and walking. These transportation modes can play an increasingly significant role in a balanced intermodal transportation system” (Federal Highway Administration 1992a). However, despite the new federal rules, it takes a while to turn the ship of state. Massachusetts has a bicycle/pedestrian coordinator, as required by ISTEA, and a Statewide Bicycle Transportation Plan was released in April 1998 (Vanasse Hangen Brustlin, Inc. 1998), but no large scale shift from automobile to bicycle has occurred.
Despite signs of change, transportation politics and planning in Boston are still symbolic of the larger car culture in the United States (Williams and Larson 1996), where cars are sometimes regarded as highly as the family pet (Grava 1993). Despite ISTEA, Bicycle facilities and mass transit have taken a back seat to automobiles and highways. In Boston, this is epitomized by the $10 billion Central Artery/Tunnel Project. This project has been described as: “… one of the largest, most technically difficult and environmentally challenging infrastructure projects ever undertaken in the United States. The project spans 7.5 miles of highway, 160 lane miles in all, about half in tunnels. The Project will place 3.8 million cubic yards of concrete – the equivalent of 2,350 acres, one foot thick – and excavate 13 million cubic yards of soil (Central Artery/Tunnel Project 1998).
Estimates are that 190,000 vehicles squeeze through the current extremely congested highway system each day. Experts expect the new system will comfortably accommodate at least 250,000 vehicles each day (Central Artery/Tunnel Project 1998). However, it is reasonable to expect that more roads and fewer tie-ups will attract more drivers (Jacobs 1961). Therefore, critics of the CA/T expect vehicle traffic will quickly outstrip the capacity of the new infrastructure.
Planners and politicians cite culture and climate as conspiring against bicycling in Boston. Most Bostonians do not consider bicycling as a realistic transportation option; rather it is seen as an important form of recreation (Seijts et al. 1995). A dedicated, but relatively small clique of Massachusetts’ bicyclists and bicycle organizations lobby for better facilities. Groups such as MassBike (formerly the Massachusetts Bicycle Coalition), the Massachusetts Bicycle Safety Alliance, and the Charles River Wheelman advocate for better bicycle facilities. However, these efforts hardly compare to the efforts of the automobile lobby. According to records from the Massachusetts Secretary of State’s office, the automobile lobby spent $363,216 in 1992 compared to zero dollars for the grass-roots bicycle lobby (Public Records Division 1992).
Despite the relatively small numbers of bicyclists, many serious bicycle-related injuries do occur in and around Boston. Bicycle-related head injury is regarded as a serious and costly problem and helmets are seen as an important remedy (Centers for Disease Control and Prevention 1995; Friede, Azzara, Gallagher, Guyer 1985; Table 2 in Jaffe, Massagli, Martin, Rivara, Fay, Polissar 1993). The Centers for Disease Control and Prevention recommends, "bicycle helmets should be worn by all persons (i.e., bicycle operators and passengers) at any age when bicycling" (Centers for Disease Control and Prevention 1995). In the United States, considerable effort has been devoted to promoting bicycle helmets (DiGuiseppe, Rivara, Koepsell, Polissar 1989; Federal Highway Administration 1995; Howland et al.1989; Puczynski and Marshall 1992), and Boston is on the forefront. A large number of government programs and professional organizations promote bicycle safety in the Boston area (Guttag 1997).
Amsterdam Today Amsterdam is famous for its hordes of cyclists, but it wasn’t always that way. In fact, the use of motor vehicles and bicycles has fluctuated over time. For instance, there was a decrease in bicycle use from 1963 to 1973 (Welleman 1995). However, the Dutch responded to the OPEC oil embargo by bicycling more, and recent estimates are that from 27% to 50% of all traffic movements in different Dutch cities are made on bicycles (Welleman 1995). Because so many people ride bicycles, the Netherlands is sometimes referred to as one of the bicycle monarchies of Northern Europe. Even the Prime Minister, Wim Kok, commutes by bicycle almost every day.
High rates of bicycling in the Netherlands are the result of strong beliefs in the bicycle as a form of sustainable transport and in purposeful long-term transportation planning. Traffic planners and politicians have made a clear and rational decision to promote bicycles and discourage use of motor vehicles. Master Plan Bicycle was established within the Dutch Ministry of Transport in 1990, specifically with this aim (Welleman 1995).
For many years, Europeans and Americans have looked to the Netherlands for ideas on transportation planning and policy (Suzuki 1984), and “Masterplan Bicycle,” shows why this tiny nation attracts such attention. This was the first time any country had established “an official national bicycle policy” (Federal Highway Administration 1992b). Remarkably, from an American standpoint, the policy was aimed at increasing bicycling and mass transit use and decreasing motor vehicle use. Along with building more bicycle paths and parking facilities, a major goal was to improve bicycle/public transport connections (Federal Highway Administration 1992b).
Bicycle safety is an important concern for Dutch traffic planners, however, unlike in the United States, bicycle safety does not revolve around helmets (Seijts et al. 1995). In fact, about the only people wearing helmets in the Netherlands are foreigners. Bicycle safety is attained through thoughtful road architecture, bicycle lanes, and by extensive education of cyclists and car drivers about the rules of the road. Rule number one is to respect other drivers, including bicyclists. Bicyclists are considered drivers, similar to motor vehicle drivers, but they are given the status of “vulnerable users” (VERJO traffic editors group 1997).
The concept of a woonerf zone was introduced by Dutch safety experts in the early 1970s (Federal Highway Administration 1994b), and since then these zones have been widely adopted in Europe (Suzuki 1984. The woonerf is a “protected residential environment with street space shared equally among pedestrians, cyclists and cars ‘proceeding at walking pace’” (Federal Highway Administration 1992b). In a woonerf zone, pedestrians and bicyclists have priority over motor vehicles (Federal Highway Administration 1992b). The impressive physical facilities available to Dutch bicyclists are matched by extensive traffic safety education for children and adults. Many Dutch children are first exposed to cycling when they are infants or toddlers, riding on their parent’s bicycle. Education continues in school, and even includes a component aimed at helping teens resist pressure from risk-taking peers. In Amsterdam, adult cyclists are often seen riding beside small children, one hand on the child’s shoulder, guiding them and verbally instructing them on the rules of the road. In addition, truck and bus drivers are taught how to share the road with bicyclists, and instruction is available for foreigners (Wittink 1993).
Methods Data were collected in blocks of 20 cases with the observer(s) seated at a single location, in fair weather conditions, with temperatures between 10 and 32 degrees Celsius (50 and 90 degrees Fahrenheit). Observation dates were recorded along with the beginning and ending times of each data collection block. This allowed us to calculate the number of passing bicyclists per hour and group cases according to time of day, day of week, and time of year. The data collection form is shown in Exhibit 1. The two dependent variables were helmet and light use. Bicyclists wearing helmets that were not properly fastened or positioned were still coded as wearing a helmet, but a comment was included indicating the specific type of misuse. Riders carrying a helmet anywhere other than on their head (e.g., on handlebars or attached to their belts), received a zero in the helmet column and a note was included in the comments. The light variable recorded whether the bicycle was equipped with active lights, or whether the bicyclist had a light attached to their backpack, etc. By specifying lights had to be active, passive reflectors were excluded. In these analyses, light use was considered a simple dichotomy -- "yes" or "no." "Yes" included bicyclists with a working headlight, a working taillight, or both.
Exhibit 1
Bicycle Safety Code Sheet (6/28/98)
First tenSecond ten Street Street __________________________________________ Vehicle 1 2 3 4 5 Vehicle 1 2 3 4 5 Traffic: Heavy H/Med Med Med/L Light Traffic: Heavy H/Med Med Med/L Light
Temperature Dark: yes no Temperature Dark: yes no
Observer City ____________________________________
RIDERTYP (Mess, Exer, Commut, Shop, Other, Delivery, Police, Don't Know=X) BIKETYPE (Trad, Racer,
Mount/city, Cruiser, Travel, Banana, other, tandem, BMX,
Hybrid, Juvenile, missing=X)
Observation sites were carefully
selected and thoroughly documented to allow replication over time.
Recording precise locations, times, dates, and temperatures makes this
observational method appropriate for drawing international comparisons,
as well as urban/suburban comparisons in the same country. For instance,
we can control for bicycles per hour, and compare helmet use among daytime
riders in two different countries. Alternatively, given careful targeting
to local areas, this method could be used to evaluate specific helmet
promotion programs.
United Nations data on bicycle
and passenger car deaths in France, United States, and the Netherlands
are also presented in this paper (1995). These aggregate data provide
a context for understanding the observation data on bicycle use and
safety behavior.
Statistical Packages for the
Social Sciences (SPSS) are used for analyses (1994). Percentages are
reported and, Quattro Pro 5.0 is used to present results graphically
(1993). There were large, statistically significant differences between
the three cities in use of helmets and lights.
Results and Discussion
This study of urban bicycle use and safety
began in Paris in 1995, results were replicated in Boston beginning
in spring 1996, and then in Amsterdam in October 1997. These cities
were chosen for convenience and because they offer interesting cultural
contrasts and transportation approaches.
s
Exhibit 2 shows data on background factors potentially
related to bicycling in the three cities. For each city, population,
area (Sq. km), and Pop/km data were obtained from the same source.
Therefore, although city definitions may vary, the population/km density
data should be comparable.
Exhibit 2
Comparison of Demographic and Geographic Data
Pop.
Sq. km
Pop/km
Avg.
Temp C
Avg. mm
Precipitation
Paris
2,152,423
105.4
20,421
11.7
641.6
574,283
125.4
4,581
10.8
1066.8
715,063
167.0
4,283
9.5
797.8
Sources: Paris data: Paris Weather
and Climate Page 1998; Direction Générale des Impôts 1997; Boston data:
Toucan Valley Publications 1996; Boston Demographics 1998; Amsterdam
data: Office of Research and Statistics 1998; Statistical Yearbook 1997.
Exhibit 3 shows that there are about 200 more cars
per 1,000 population in the United States compared to the Netherlands,
and France is much closer to the Netherlands figure than to the U.S.
figure (Pucher 1990, p. 444 and p. 447). In the U.S., more than 8 of
10 trips are made by car, compared to about 4.5 trips of 10 in the Netherlands,
and 4.7 trips per 10 in France. In France, this is accomplished by
greater use of mass transportation and in the Netherlands it is accomplished
by greater use of bicycles.
Exhibit 3
Cars per Population
and Modal Splits
Percentage of
Total Trips
Cars per 1,000
population
Cars
Public Transport
Pedestrian &
Bicycle
France
393
47
11
35
United States
555
82
3
10
Netherlands
348
45
5
48
Exhibit 4 shows the number of
passing bicycles per hour in the three cities. Boston has the fewest
bicyclists, at 55 per hour, Paris is next at 74, and the observations
in Amsterdam yielded an astounding 242 cyclists per hour. Furthermore,
the Amsterdam figure is actually much higher. Bicycle traffic was so
heavy in Amsterdam that we had to pick locations where volume was low,
so that we could reliably code safety behavior variables. In addition,
on larger streets in Amsterdam, we only counted bicyclists going in
one direction. Consequently, these bicycle counts are not strictly
comparable. However, the crux of Exhibit 4 is valid: Boston has the
lowest density of cyclists, Paris has quite a lot more, and Amsterdam
is packed with cyclists.
Exhibit 4
Exhibit 5 shows death rates
from cycling in the United States, the Netherlands, and France. In
the U.S., there are 3.1 deaths per million population compared to 5.6
in France and 17.7 deaths per million in the Netherlands. Exhibit 6
shows similar data on passenger car deaths in the same three countries
and Exhibit 7 shows combined bicycle and car deaths. Exhibits 6 and
7 show a dramatically lower death rate in the Netherlands for people
in passenger cars and for the combined group of cyclists and passenger
car occupants.
Exhibit 5
Exhibit 7
Exhibit 8 shows the age distribution
of deceased cyclists in the three countries. The age distribution in
the U.S. is very different from the distributions in the Netherlands
and France. About half of cyclists who die in the U.S. are 24 years
of age or younger, compared to just over 30% in the Netherlands and
France. In France, and especially in the Netherlands, people in the
65-plus group comprise a large proportion of the bicycle-related deaths.
This reflects the fact that the bicycle is more widely used by adults
in Europe than it is in the United States.
Exhibit 8
Exhibit 9 presents data on helmet wearing and use
of lights. Over 30 percent of Boston cyclists wore helmets (32.0%),
only 2.4% of Paris cyclists wore helmets, and only 0.1% of Amsterdam
cyclists we observed wore helmets. There is an interesting contrast
with use of lights. Paris cyclists are far more likely to use lights
at night (45.2%), than Boston cyclists (15.6%) or Amsterdam cyclists
(7.6%).
Exhibit 9
Exhibit 10 shows three other
variables that differentiate cyclists in the three cities. In Boston,
only 19.0% of riders were female, versus 30% in Paris, and 42.7% in
Amsterdam. Boston had the lowest proportion of older cyclists; only
7.4% were in the category of age 51 plus, versus 10.4% in Paris, and
15.1% in Amsterdam. Finally, something that is apparent to even casual
observers, cyclists in Amsterdam are more likely to be carrying passengers
(4.1%) than cyclists in the other two cities.
Exhibit 10
Strengths and Limitations
This study has several strengths
along with some potential limitations. The large number of cases observed
is one strong aspect. We are very confident about the large differences
in helmet and light use in the three cities. We can also begin to understand
the influence of other variables on use of helmets and lights, such
as time of day, time of week, age, and gender.
Strict scientific methods were used to document
observation sites, selection criteria, times, and temperatures, thus
allowing replication over time. Another strength involves the data
collection method; direct observation is generally preferred over surveying
people about safety behavior (DiGuiseppi, Rivara, Koepsell, Polissar
1989; Schieber, Kresnow, Sacks, Pledger, O'Neil, Toomey 1996).
On the other hand, as in other similar studies
(DiGuiseppi, Rivara, Kowpsell, Polissar 1989), there are probably some
errors in our age group estimates. To minimize misclassification error,
we kept age categories broad (toddler to 11, 12 to 17, 18 to 50, and
51+). Nevertheless, this was usually the most difficult variable to
code and required good vision and a good location (e.g., under a street
light at night). Coding gender and helmet use was easier, but in some
cases it was difficult to distinguish active tail lights from passive
reflectors.
Some researchers go to great lengths to avoid
double counting bicyclists. However, these studies are generally aimed
at small numbers of children in non-urban areas. Double counting does
not pose a threat to validity when observing large numbers of urban
bicyclists at different locations. In fact, because many people who
have helmets do not wear them consistently (Rodgers 1995, p. 46), it
makes sense to count "repeats" on different days. They may
wear a helmet one day and not another day.
Our exclusion criteria specify that the same
bicyclist not be coded twice in the same data collection block, or in
contiguous data collection blocks at the same location. However, the
same bicyclist can be recorded again later on the same day. Another
approach to avoid double counting within the same session is to code
at transit points to recreation areas. For example, in Boston, several
pedestrian ramps lead down to the main Charles River Esplanade bicycle
path. Bicyclists rarely go up or down the same ramp more than once
on a single ride. Depending on time of day, bicyclists either going
up or down the ramp are coded. Other strategies to avoid double counting
are to limit the number of bicyclists coded at the same location on
the same day, and to pay close attention to bicyclists' characteristics
and clothing, so those who have already passed are not coded again.
Death rates (our numerators
for Exhibits 5, 6, and 7) represent the most serious cases of trauma
experienced by bicyclists and vehicle occupants. Death rates are the
tip of the injury pyramid and for each death there are thousands of
injuries treated at home, in a doctor’s office, emergency department,
or hospital (National Committee for Injury Prevention and Control 1989,
p. 37). However, because comparative data on injury morbidity
are much less reliable than mortality data, we do not present analogous
UN data on morbidity. Similarly, we prefer to use fairly “hard” country
population figures as the denominators, rather than estimates of miles
traveled in motor vehicles, much less on bicycles.
Conclusion
According to United Nations data on passenger
car- and bicycle-related deaths, transportation in the Netherlands is
safer than in the U.S. or France. The Netherlands has death rates from
bicycles and cars that are declining and are far below those in France
and the United States.
Since 1990, all three countries
(France, United States, and the Netherlands) have passed major national
legislation promoting bicycling. Deaths and injuries in the Netherlands
could be further reduced if Dutch bicyclists wore helmets and used lights
at night. However, American experts are in no position to lecture the
Dutch about bicycle safety; rather we need to look to the Netherlands
for ideas on promoting cycling and building safe bicycle-friendly environments.
We believe five factors explain the lower combined car/cycle
death rates in the Netherlands.
1.
Potential car drivers are
instead riding bicycles.
2.
The
heavy focus on cyclist, driver, and pedestrian education has produced
mostly careful and courteous travelers.
3.
Separation of different
types of traffic in certain areas has eliminated intra-vehicle conflict
(i.e., truck versus tricycle).
4.
Traffic calming (Grava
1993), including woonerf zones, has slowed traffic and reduced
injuries, as intended.
5.
The dense population in
the Netherlands makes it possible for people to carry on their day-to-day
activities closer to home, thus reducing miles traveled, traffic congestion,
and potential injuries and deaths.
In the transportation arena,
the Netherlands is a terrific model of another way of doing business.
A bicycle-friendly environment was created through great political will
(Horman 1995) and innovative long-term traffic planning. Consequently,
today Dutch citizens are able to choose sustainable and healthy cycling
over driving a car for many of their day-to-day trips. A combination
of segregated bicycle lanes, integrated bicycle and motor vehicle lanes,
and extensive education, has created a climate where bicycling is considered
a safe and practical option, which many people choose.> Although
the Dutch model cannot be replicated everywhere, the model does contain
important lessons about urban traffic flow and public safety as well
as sustainability and quality of life.
REFERENCES
Boston Demographics.
http://www.bweb.com/bostonweb/ideas/demographics.htm
retrieved February 18, 1998.
Central Artery/Tunnel
Project. http://www.bigdig.com/home.htm retrieved April 17, 1998.
Dansk Cyklist Forbund. http://pauli.uni2.dk/dcf/index.htm
retrieved March 18, 1998.
Direction Générale
des Impôts. Tableau A.01-5. Annuaire Statistique de la France édition
1997.
Grava S. Traffic Calming
– Can it be done in America? Transport. Quarterly. 1993;47(4):483-505.
Jacobs J. The
Death and Life of Great American Cities.> Vintage
Books, New York, 1961.
Levinson HS. Cities,
Transportation and Change. Transport. Quarterly 1996;50(4):67-85.
Office of Research
and Statistics. http://www.onderzoek-en-statistiek.amsterdam.nl
Puczynski M, Marshall
DA. Helmets! all the pros wear them. AJDC. 1992;146:1465-1467.
Quattro Pro 5.0 for
Windows. Borland Corporation, 1993.
SPSS, Inc. SPSS for
Windows. Release 6.1 June 23, 1994
Statistical Yearbook
1997. Abrahamse APJ. Statistics Netherlands, 1997.
Suzuki PT. The National
Urban Freeway System of the Netherlands: Transportation Policies and
Innovations in a Small Nation. Transport. Quarterly. 1984;38(4):551-558.
|
||||||||||||||||||||||||||||||||||||||||||||||||||||||||||||||||||||||||||||||||||||||||||||||||||||||||||||||||||||||||||||||||||||||||||||||||||||||||||||||||||||||||||||||||||||||||||||||||||||||||||||||||||||||||||||||||||||||||||||||||||||||||||||||||||||||||||||||||||||||||||||||||||||||||||||||||||||||||||||||||||||||||||||||||||||||||||||||||||||||||||||