Rates of Motor Vehicle Crashes, Injuries and Deaths in Relation to Driver Age, United States, 2014-2015
This Research Brief presents updated data on crash risk using data on crashes from the US DOT in conjunction with data on driving mileage from the AAA Foundation's American Driving Survey.
June 2017
Suggested Citation
For media inquiries, contact:
Tamra Johnson
202-942-2079
TRJohnson@national.aaa.com
This Research Brief provides updated statistics on rates of crashes, injuries and death per mile driven in relation to driver age based on the most recent data available, from 2014-2015. Drivers ages 16-17 continue to have the highest rates of crash involvement, injuries to themselves and others and deaths of others in crashes in which they are involved. Drivers age 80 and older have the highest rates of driver deaths. Drivers ages 60-69 were the safest drivers by most measures examined.
Methods
Rates per 100 million miles driven of driver involvements in all police-reported crashes, crashes resulting in at least one police-reported injury but no deaths (injury crash) and crashes resulting in at least one death (fatal crash) were computed using data from 2014–2015. Data on drivers involved in police-reported crashes and on people injured in crashes were from a representative sample of all police-reported motor vehicle crashes nationwide (National Highway Traffic Safety Administration [NHTSA], 2016a). Data on fatal crashes and people killed in crashes were from a database of all fatal motor vehicle crashes nationwide (NHTSA, 2016b). Data on the number of miles driven were from a representative sample of all drivers nationwide (Triplett et al., 2016).
People injured or killed in crashes were paired with each driver involved in the crash (subject driver) and were classified as the subject driver, a passenger in the subject driver’s vehicle or a person outside of the subject driver’s vehicle, as described in a previous AAA Foundation for Traffic Safety report by Tefft (2012). Rates of injuries and deaths per mile driven of drivers, their passengers and other people outside of the driver’s vehicle were calculated by dividing the total number of people injured and killed in crashes involving subject drivers in each age group by the total number of miles driven by drivers in the same age group. People injured and killed in multivehicle crashes were counted more than once; for example, in a two-vehicle crash in which both drivers are injured, each driver appears in the analysis as an injured subject driver and also as an injured person outside of the other subject driver’s vehicle.
Crash involvement and driving exposure were quantified for drivers of cars, pickup trucks, vans, minivans and sport utility vehicles only; however, all people injured and killed in crashes that involved at least one such driver were included in counts and rates of injuries and deaths.
Results
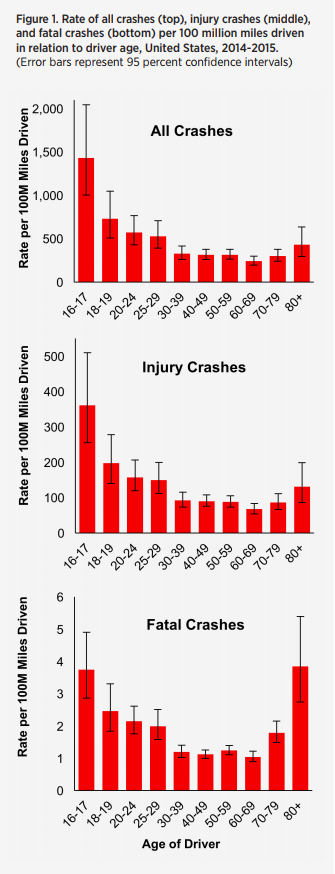
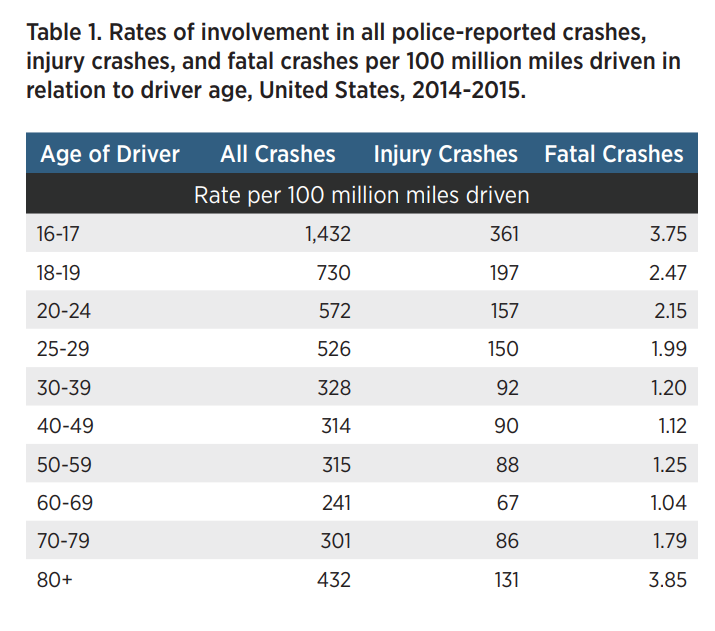
Figure 1 shows the crash involvement rate of drivers per 100 million miles driven in relation to driver age. The crash rate of drivers ages 16-17 years was nearly double that of drivers ages 18-19 and approximately 4.5 times that of drivers ages 30-39, 40-49, and 50-59 (Table 1). Drivers ages 60-69 had the lowest crash rate. Crash rates began to increase beyond age 70; however, drivers ages 70-79 had crash rates similar to or lower than those of drivers ages 30-59, and drivers age 80 and older had crash rate higher than those of drivers ages 30-79 but lower than those of drivers younger than age 30. Rates of injury crashes generally followed a pattern very similar to overall crash involvement rates.
Rates of fatal crashes followed a somewhat different pattern. Fatal crash involvements per 100 million miles driven were the greatest for drivers age 80 and older.
Among drivers younger than 80, rates of involvement in fatal crashes were highest among drivers ages 16-17 and lowest among drivers ages 60-69, but the degree to which rates of fatal crashes decreased with increasing age was somewhat smaller than it was among injury crashes and among all police-reported crashes. The fatal crash involvement rate of drivers ages 70-79 was also notably elevated relative to that of drivers ages 30-59 and was comparable to that of drivers ages 25-29.
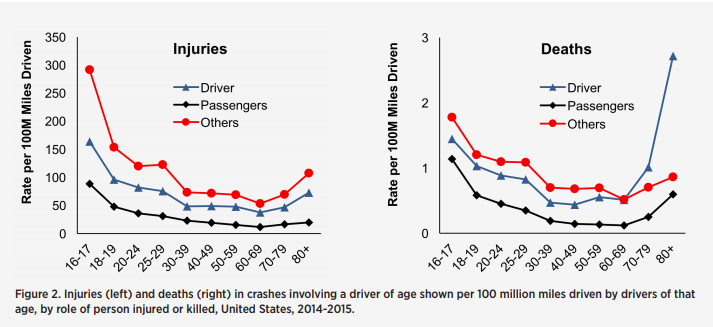
Figure 2 shows the mileage-based rates of driver injuries and deaths, rates of injuries and deaths of their passengers, and rates of injuries and deaths of other people outside of the driver’s vehicle, in relation to driver age. Injury rates generally follow a pattern similar to that of overall crash involvement rates. Rates of deaths of others outside of the driver’s vehicle also follow a similar pattern, with the major exception of the death rates of drivers age 80 and older. Whereas their mileage-based rates of deaths of other people outside of the driver’s vehicle were only about 22 percent greater than those of drivers ages 30-59 and were lower than those of drivers younger than 30, drivers age 80 and older had more than six times the death rate of drivers ages 30-49 and nearly double the death rate of teens.
Discussion
Using the most recent available national data on driver crash involvement and driving exposure, this study finds that by most measures, the youngest drivers continue to have by far the greatest driving risk. Risk decreases rapidly with age through the teens and 20s, continues decreasing albeit more slowly through the 30s, 40s and 50s, are lowest for drivers in their 60s, and then increase slightly for drivers age 70 and older. Overall rates of crash involvement per mile driven, rates of injuries and deaths of other people outside of the driver’s vehicle and rates of driver injury all followed this pattern. The major exception was the rate of driver deaths, which was lowest for drivers in their 30s and was by far the highest for drivers age 80 and older, who by all other measures examined had risks comparable to drivers in their 20s or 30s.
In light of their comparatively low overall crash involvement rates and rates of injuries and deaths of other people outside of their vehicle, the high death rate of the oldest drivers clearly reflects older people’s elevated risk of dying in the event of a crash, and not excessive risk of crash involvement. This finding, first reported by Li et al. (2003) in a study of data from years 1993-1997 clearly is still applicable today.
The AAA Foundation’s last study of crash rates per mile driven in relation to driver age (Tefft, 2012) used data from 2008-2009, due to lack of data on person-level driving exposure in the years between 2009 and the present. Although crash rate estimates from that study are not strictly comparable to those of the current study due to differences in the data used to estimate driving exposure, some general patterns are clear. While teenage drivers, young adults ages 20-24 and drivers age 80 and older had the highest crash rates in both the previous study and the current study, the crash rates of these groups also decreased substantially; whereas differences in the crash rates of middle-aged drivers, who are the safest by most measures, changed little.
The number of drivers involved in police-reported crashes increased by 4.8 percent from 2014 to 2015, and the number involved in fatal crashes increased by 9.0 percent (Table A1), both much larger than the 2.4 percent increase in the total number of miles driven in light vehicles over the same period (Triplett et al., 2016). Unfortunately, the sample size of the data used to quantify driving exposure was insufficient to produce reliable estimates of changes in driving exposure from 2014 to 2015 in relation to driver age. Thus, while the study was able to quantify average rates of crashes, injuries and deaths in relation to driver age for years 2014-2015 combined, it was not possible to do so for individual years. Thus, while the increase in the number of drivers involved in crashes clearly varied by age, this study was unable determine whether crash rates per mile driven increased uniformly across all age groups from 2014 to 2015 or whether some of the increase in overall population-level crash rates may have been attributable to differential changes in the driving exposure of drivers of different ages.
References
Li G, Braver ER, Chen L-H. (2003). Fragility versus excessive crash involvement as determinants of high death rates per vehicle-mile of travel among older drivers. Accident Analysis & Prevention. 35(2): 227-235.
National Highway Traffic Safety Administration. (2016a). General Estimates System [Data files]. Modified 09/12/2016. Accessed 09/14/2016. Available at ftp://ftp.nhtsa.dot.gov/GES/. Washington, DC: National Highway Traffic Safety Administration.
National Highway Traffic Safety Administration. (2016b). Fatality Analysis Reporting System [Data files]. Modified 09/12/2016. Accessed 09/14/2016. Available at ftp://ftp.nhtsa.dot.gov/FARS/. Washington, DC: National Highway Traffic Safety Administration.
Tefft BC. (2012). Motor Vehicle Crashes, Injuries, and Deaths in Relation to Driver Age, United States, 1995-2010. Washington, DC: AAA Foundation for Traffic Safety.
Triplett T, Santos R, Rosenbloom S. (2016). American Driving Survey: 2014-2015. Washington, DC: AAA Foundation for Traffic Safety.
Suggested Citation
For media inquiries, contact:
Tamra Johnson
202-942-2079
TRJohnson@national.aaa.com